
Breaking: Gold and Silver Suffer Historic Single-Day Crash
January 30, 2026 - The precious metals market was shaken to its core today as gold and silver prices experienced their most severe single-day sell-off in over thirteen years. What started as a routine trading session turned into a bloodbath, with gold tumbling as much as 8% and silver plummeting a staggering 17%.
This wasn't just another bad day for metals. This was the kind of market event that gets talked about for years.
What Exactly Happened Today?
Let's break down the numbers because they're extraordinary.
Gold's Dramatic Fall
Gold spot prices opened near their all-time high of $5,595 per ounce - a level reached just yesterday, January 29th. By mid-morning, prices had crashed to an intraday low of $4,941 per ounce. That's a drop of over $650 in a matter of hours.
By 7:12 a.m. ET, gold had recovered slightly to around $5,136 per ounce, but the damage was done. This marks gold's worst single-day percentage decline since the infamous 9% crash on April 15, 2013.
Silver's Even Wilder Ride
Silver's moves were even more dramatic. From a peak of $120.45 per ounce yesterday, prices collapsed to just $95 per ounce at the day's low - a gut-wrenching 17% drop.
Later in the session, silver stabilized near $103 per ounce, but many traders were left reeling from the volatility. This was silver's most volatile session in recent history, surpassing even the sharp declines of December 2025 and August 2020.
Today's Price Snapshot
| Metal | Yesterday's High | Today's Low | Percentage Drop | Current Level | January 2026 Gain |
|---|---|---|---|---|---|
| Gold | $5,595/oz | $4,941/oz | Up to 8% | ~$5,136/oz | ~24% |
| Silver | $120.45/oz | $95/oz | Up to 17% | ~$103/oz | Over 40% |
| Platinum | N/A | Below $2,000/oz | Over 10% | ~$1,950/oz | N/A |
| Palladium | N/A | N/A | Nearly 8% | N/A | N/A |
| Copper | Above $14,000/ton | N/A | Over 3% | ~$13,500/ton | N/A |
For live prices updated every 30 seconds, visit our homepage.
The Trigger: Trump Picks Kevin Warsh as Fed Chair
So what caused this sudden reversal after months of relentless gains?
The primary catalyst was President Donald Trump's announcement that he's nominating Kevin Warsh as the next Federal Reserve Chair, succeeding Jerome Powell.
Who is Kevin Warsh?
Warsh is a former Fed governor who served during the 2008 financial crisis. At just 35 years old when he joined the Fed Board, he was the youngest appointee in the institution's history. He's known for:
- Hawkish monetary policy views - historically worried about inflation even during recessions
- Skepticism of quantitative easing - he dissented on QE2 and believes the Fed's balance sheet is bloated
- Support for central bank independence - he's criticized what he calls "mission creep" into areas like climate policy
- Recent optimism on AI - he believes artificial intelligence will boost productivity and help contain inflation
Why Did This Nomination Crash Gold and Silver?
Here's the key insight: The entire precious metals rally of the past year was built on expectations of dollar weakness and aggressive Fed rate cuts.
Warsh's nomination signals the opposite. As Krishna Guha from Evercore ISI put it:
"The Warsh pick should help stabilize the dollar some and reduce the asymmetric risk of deep extended dollar weakness by challenging debasement trades - which is also why gold and silver are sharply lower."
In plain English: Markets were betting that the Fed would keep printing money and weakening the dollar. A more disciplined Fed Chair means that bet might not pay off.
The US dollar immediately strengthened on the news, making dollar-denominated commodities like gold and silver more expensive for international buyers.
But Wait - There's More to This Story
While the Warsh nomination was the immediate trigger, the sell-off was also a technical correction that was long overdue.
The Numbers Were Unsustainable
Consider how far these metals had run:
- Gold: Up approximately 24% in January alone - its best monthly performance since the 1980s
- Silver: Up over 40% year-to-date and on track for its ninth consecutive monthly gain
- Gold/Silver Ratio: Hit a 14-year low of 45:1, raising bubble concerns
Technical indicators were flashing red. Gold's Relative Strength Index (RSI) had exceeded 90 - a level that almost always precedes a correction. Anything above 70 is considered overbought; 90 is extreme.
Profit-Taking Was Inevitable
Christopher Wong from Oversea-Chinese Banking Corp. described the situation perfectly:
"A correction was overdue. The nomination reports served as one of those excuses markets are waiting for to unwind those parabolic moves."
In other words, traders were looking for any reason to book profits. The Warsh news gave them one.
The Ripple Effects: What Else Got Hit?
The precious metals crash didn't happen in isolation. It sent shockwaves through related markets.
Mining Stocks Hammered
| Company | Drop | Details |
|---|---|---|
| Fresnillo (World's largest silver producer) | -4% | London-listed |
| Endeavour Silver | -9% | Pre-market |
| Coeur Mining | -8% | Pre-market |
| Stoxx 600 Basic Resources Index | -2% | European basket |
ETFs Took Heavy Losses
| ETF | Drop | Type |
|---|---|---|
| ProShares Ultra Silver (AGQ) | Over 22% | 2x Leveraged Silver |
| iShares Silver Trust (SLV) | -11.2% | Physical Silver |
| Indian Gold/Silver ETFs | Up to 20% | Various |
Other Commodities Also Fell
The sell-off wasn't limited to precious metals:
- Platinum: Down more than 10%, falling below $2,000/oz
- Palladium: Dropped nearly 8%
- Copper: Fell over 3% after briefly surpassing $14,000/ton
The Perfect Storm That Created the Rally
To understand today's crash, you need to understand what created the rally in the first place. It was a perfect storm of factors:
1. Geopolitical Chaos
The past few months have seen:
- US capture of Venezuelan President Nicolas Maduro
- Trump's threats of military action regarding Greenland and Iran
- New tariffs on South Korean imports
- Ongoing tensions with China
All of this drove investors toward safe-haven assets.
2. Central Bank Gold Buying
Central banks worldwide have been accumulating gold as part of "de-dollarization" efforts. This steady institutional buying provided a floor for prices.
3. Rate Cut Expectations
Markets were pricing in aggressive Fed rate cuts, which typically weaken the dollar and support precious metals.
4. Industrial Demand for Silver
Silver has benefited from:
- Solar panel manufacturing - China alone produces 150+ GW annually
- Electronics - smartphones, computers, and more
- Electric vehicles - silver in electrical contacts and batteries
Historical Context: How Does This Compare?
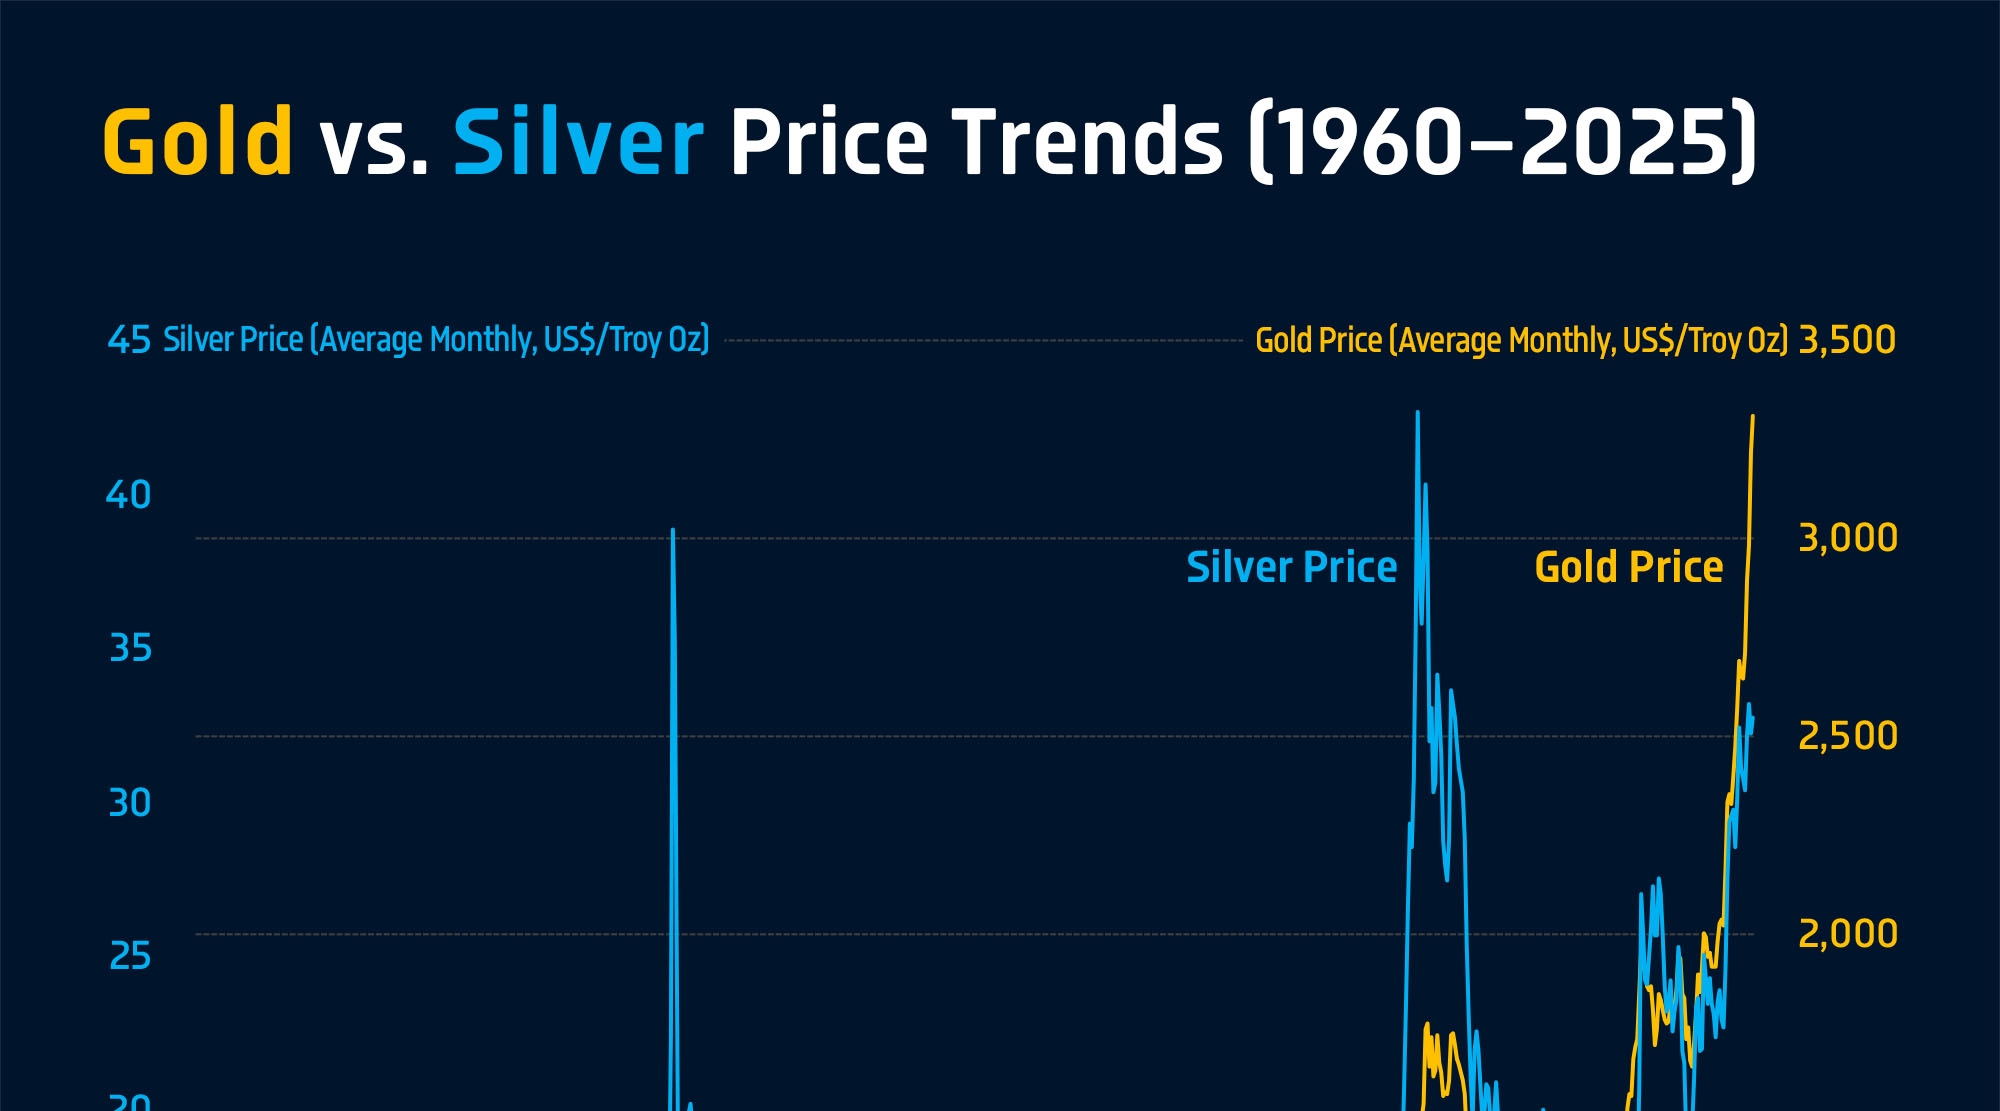
Today's crash puts things in perspective. Looking at the long-term chart above, you can see that precious metals have experienced sharp corrections before, but they've also delivered tremendous gains over decades.
Comparing to Past Crashes
| Event | Date | Gold Drop | Silver Drop |
|---|---|---|---|
| Today | Jan 30, 2026 | 8% | 17% |
| April 2013 Crash | Apr 15, 2013 | 9% | 11% |
| COVID Panic | Mar 2020 | 12% (over days) | 20%+ |
| 2011 Silver Crash | May 2011 | 3% | 30% (over days) |
What's notable about today is the speed of the decline. This wasn't a slow grind lower - it was a flash crash that caught many off guard.
What the Experts Are Saying
Bulls Remain Confident
Toni Meadows from BRI Wealth Management:
"The case for further reserve diversification is still there. Trump's policies may unnerve emerging markets aligned with China or Russia, supporting continued central bank gold buying."
Some See Buying Opportunities
AI-driven forecasts suggest gold could rebound toward $10,000 by April, supported by declining real yields and growing global debt. However, these projections come with significant uncertainty.
Cautious Voices
Bank of America had already flagged silver as overheated by 30% above long-term fundamentals before today's crash. The gold-to-silver ratio hitting a 14-year low was a warning sign many chose to ignore.
What Does Kevin Warsh's Fed Look Like?
Since the Warsh nomination is central to today's move, it's worth understanding what his Fed might do.
His Key Policy Positions
| Issue | Warsh's View | Market Implication |
|---|---|---|
| Inflation | A "choice" from loose policy, not inevitable | Less tolerance for easy money |
| Interest Rates | Supports lower rates, offset by QT | Mixed - cuts possible but with constraints |
| Balance Sheet | Wants aggressive shrinking | Tighter liquidity |
| Fed Independence | Strongly supports, criticizes "mission creep" | More predictable policy |
| AI & Productivity | Very optimistic | Could support rate cuts if inflation stays low |
The Bottom Line on Warsh
He's not a simple hawk or dove. He's a reformed pragmatist who believes:
- The Fed has strayed too far from its core mission
- Quantitative easing created distortions that hurt Main Street
- AI will fundamentally change the inflation picture
- The Fed should be disciplined but not destructive
Impact on Indian Markets
For our Indian readers, here's what happened in domestic markets:
MCX Silver Crashed ₹80,000 from Peak
- MCX Silver fell from its all-time high, losing approximately ₹80,000 per kg from peak levels
- MCX Gold dropped about ₹25,000 from its recent highs
Rupee Impact
The strengthening US dollar added pressure on the rupee, partially offsetting the international price decline for Indian buyers.
What This Means for Indian Buyers
If you were planning to buy silver at ₹400+/gram, you might get better prices in coming days. However, don't expect a return to ₹300 levels - the underlying demand story remains intact.
Live Silver Rate Today: City-Wise Prices in India
Here's how the crash affected silver prices across major Indian cities. These are live silver rates that reflect today's dramatic fall:
| City | Silver Rate Today (₹/10g) | Change | Silver Rate Today (₹/kg) |
|---|---|---|---|
| Mumbai | ₹3,550-3,650 | ↓ 12-15% | ₹3,55,000-3,65,000 |
| Delhi | ₹3,540-3,640 | ↓ 12-15% | ₹3,54,000-3,64,000 |
| Chennai | ₹3,560-3,660 | ↓ 12-15% | ₹3,56,000-3,66,000 |
| Kolkata | ₹3,545-3,645 | ↓ 12-15% | ₹3,54,500-3,64,500 |
| Hyderabad | ₹3,550-3,650 | ↓ 12-15% | ₹3,55,000-3,65,000 |
| Bangalore | ₹3,555-3,655 | ↓ 12-15% | ₹3,55,500-3,65,500 |
For live silver price updates, check our real-time tracker.
Gold Rate Today: City-Wise Prices (24K & 22K)
The gold crash also hit Indian markets hard. Here are today's gold rates:
24K Gold Price Today (999 Purity)
| City | Gold Rate Today (₹/10g) | Change |
|---|---|---|
| Mumbai | ₹84,500-85,500 | ↓ 6-8% |
| Delhi | ₹84,400-85,400 | ↓ 6-8% |
| Chennai | ₹84,600-85,600 | ↓ 6-8% |
| Hyderabad | ₹84,450-85,450 | ↓ 6-8% |
22K Gold Rate Today (916 Purity)
| City | Gold Rate Today (₹/10g) | Change |
|---|---|---|
| Mumbai | ₹77,500-78,500 | ↓ 6-8% |
| Delhi | ₹77,400-78,400 | ↓ 6-8% |
| Chennai | ₹77,600-78,600 | ↓ 6-8% |
| Hyderabad | ₹77,450-78,450 | ↓ 6-8% |
18 Carat Gold Rate Today (750 Purity)
| City | 18K Gold (₹/10g) | Common Use |
|---|---|---|
| All India | ₹63,500-64,500 | Diamond jewelry settings |
For live gold price updates, visit our gold page.
Why Silver is Falling Today: Complete Explanation
Many investors are asking: Why is silver falling today? Here's a comprehensive breakdown:
Primary Reasons for Silver Crash
- Fed Chair Nomination - Kevin Warsh is seen as hawkish, reducing expectations of easy money
- Dollar Strength - The USD rebounded sharply, making silver expensive for foreign buyers
- Profit Booking - After 40%+ gains in January alone, traders locked in profits
- Technical Correction - RSI above 90 signaled extreme overbought conditions
- Concentrated Positions - Too many traders were on the same side of the trade
Why Gold is Falling Today
The same factors apply to gold:
- Hawkish Fed expectations
- Dollar rebound
- Profit-taking after 24% monthly gain
- Technical indicators flashing sell signals
Is This the End of the Bull Market?
No. The fundamental case for precious metals remains intact:
- Central banks continue buying gold
- Geopolitical tensions persist
- Industrial silver demand (solar, EVs) growing
- Inflation concerns not fully resolved
MCX Live: Silver and Gold Prices Today
MCX Silver Price Today (Live)
| Contract | Price (₹/kg) | Change | Day's Range |
|---|---|---|---|
| Silver March | ₹3,58,000 | -₹65,000 (-15%) | ₹3,42,000 - ₹4,23,000 |
| Silver Mini | ₹3,57,500 | -₹64,500 (-15%) | ₹3,41,500 - ₹4,22,500 |
MCX Gold Rate Today (Live)
| Contract | Price (₹/10g) | Change | Day's Range |
|---|---|---|---|
| Gold February | ₹84,800 | -₹6,200 (-7%) | ₹83,500 - ₹91,000 |
| Gold Mini | ₹84,750 | -₹6,150 (-7%) | ₹83,450 - ₹90,950 |
Note: MCX prices are indicative. For real-time MCX live rates, check official MCX website.
COMEX Gold and Silver Prices (International)
COMEX Silver Price Today
| Metric | Value | Change |
|---|---|---|
| Spot Price | $103.50/oz | -$16.95 (-14%) |
| March Futures | $103.75/oz | -$16.70 (-14%) |
| Day's Low | $95.00/oz | Historic |
| Day's High | $120.45/oz | All-time high |
COMEX Gold Price Today
| Metric | Value | Change |
|---|---|---|
| Spot Price | $5,136/oz | -$459 (-8%) |
| February Futures | $5,142/oz | -$453 (-8%) |
| Day's Low | $4,941/oz | - |
| Day's High | $5,595/oz | All-time high |
Silver and Gold ETF Impact
The crash devastated precious metals ETFs:
Silver ETF Prices Today
| ETF | Symbol | Price Change | AUM Impact |
|---|---|---|---|
| iShares Silver Trust | SLV | -11.2% | Massive outflows |
| ProShares Ultra Silver | AGQ | -22.4% | Leveraged loss |
| Aberdeen Physical Silver | SIVR | -11.0% | Tracking spot |
| Indian Silver ETFs | Various | -15-20% | Heavy selling |
Gold ETF Prices Today
| ETF | Symbol | Price Change | Notes |
|---|---|---|---|
| SPDR Gold Trust | GLD | -7.8% | World's largest |
| iShares Gold Trust | IAU | -7.7% | Lower expense |
| Indian Gold ETFs | Various | -6-8% | MCX-linked |
Silver Price Graph: Understanding Today's Move
Looking at the silver price graph, today's crash creates a dramatic "red candle" that will be visible for years. Here's what the chart shows:
Silver Rate Graph Analysis
- January 1-29: Parabolic rise from $85 to $120 (41% gain)
- January 30: Sharp reversal, dropping to $95 (-21% from peak)
- Pattern: Classic "blow-off top" followed by profit-taking cascade
Gold Chart Analysis
- January Rally: Gold rose from $4,500 to $5,595 (24% gain)
- Today's Drop: Crashed to $4,941 (-12% from peak)
- Recovery: Bounced to $5,136 by mid-morning
For live silver chart and gold chart, visit our homepage.
Bullion Market Overview
The global bullion market experienced extreme stress today:
International Bullion Prices
| Metal | USD Price | Change |
|---|---|---|
| Gold Spot | $5,136/oz | -8% |
| Silver Spot | $103/oz | -14% |
| Platinum | $1,950/oz | -10% |
| Palladium | $1,180/oz | -8% |
Gold USD Price Conversion
| Gold Price | USD | INR Equivalent |
|---|---|---|
| Per Ounce | $5,136 | ₹4,46,832 |
| Per Gram | $165.15 | ₹14,368 |
| Per 10 Grams | $1,651.50 | ₹1,43,680 |
US Market and Commodity Market Impact
US Market Overview
The precious metals crash coincided with broader US market movements:
- US Dollar Index: Surged 1.5% on Warsh news
- US Treasury Yields: Rose as rate cut bets faded
- Gold Futures: Limit-down moves in early trading
Commodity Market Summary
The commodity market saw widespread selling:
- Energy commodities relatively stable
- Base metals (copper, aluminum) down 2-4%
- Precious metals bore the brunt of selling
Technical Analysis: Where Do We Go From Here?
Gold Support and Resistance Levels
| Level | Price (USD/oz) | Significance |
|---|---|---|
| Strong Support | $5,000 | Psychological level |
| Support | $4,800 | Previous breakout |
| Current | ~$5,136 | Today's recovery |
| Resistance | $5,400 | Previous high area |
| All-Time High | $5,595 | Yesterday's peak |
Silver Support and Resistance Levels
| Level | Price (USD/oz) | Significance |
|---|---|---|
| Strong Support | $95-100 | Today's low zone |
| Current | ~$103 | Recovery level |
| Resistance | $110 | Near-term |
| Resistance | $120 | Yesterday's high |
What Should Investors Do Now?
For Long-Term Investors
Don't panic. Today's crash, while dramatic, doesn't change the fundamental case for precious metals:
- Central banks are still diversifying away from dollars
- Geopolitical risks haven't disappeared
- Industrial demand for silver remains strong
For Short-Term Traders
Be careful. Volatility is extremely high. Today proved that prices can move 15%+ in hours. If you're not prepared for that kind of volatility, consider reducing position sizes.
For Buyers
This could be an opportunity. If you've been waiting for a pullback to buy physical silver or gold, you're getting one. However, don't try to catch the exact bottom - prices could still fall further.
For Sellers
Don't sell into panic. If you need to sell, wait for the market to stabilize. Selling at today's lows would lock in the worst possible prices.
Key Dates to Watch
| Date | Event | Potential Impact |
|---|---|---|
| Feb 1, 2026 | India Union Budget | Import duty changes could move Indian prices |
| Feb 4-5 | Next FOMC hints | Any Powell comments on transition |
| Q2 2026 | Warsh confirmation hearings | Policy details will emerge |
The Bottom Line
Today's gold and silver crash was dramatic but not unexpected. After one of the most explosive rallies in precious metals history, a correction was overdue. The Warsh nomination simply provided the catalyst.
Key takeaways:
- The drop was severe but not a trend reversal - fundamentals still support precious metals
- Technical factors amplified the move - overbought conditions, profit-taking, concentrated positions
- The Fed Chair nomination matters - Warsh signals a more disciplined Fed, which pressures the "dollar debasement" trade
- Volatility will remain high - expect continued swings as markets digest the news
- Opportunity may emerge - for patient buyers, lower prices could be a gift
Related Resources
| Resource | Description |
|---|---|
| Live Silver Prices | Real-time tracking, updated every 30 seconds |
| Live Gold Prices | Current gold rates across India |
| Silver Price Calculator | Calculate your purchase costs |
| Investment Calculator | Track your portfolio performance |
| Budget 2026 Impact | How the budget affects silver |
| Shanghai Silver Price | International price comparison |
Sources
- CNBC: "Silver plummets 15%, gold falls 7% - dragging down miners and ETFs"
- Finance Magnates: "Why Gold Is Falling With Silver Today? The Strongest XAU and XAG Selloff in 13 Years"
- Yahoo Finance: "Gold and Silver Plunge as Wild Swings Rock Metals Markets"
- Reuters: "Gold falls as investors take profits after record high"
- Times of India: "Brutal selloff! Gold, silver prices crash in exceptionally volatile session"
- Livemint: "MCX silver price crashes ₹80,000 from peak; gold down ₹25,000"
This article is for informational purposes only and does not constitute financial advice. Precious metals prices are highly volatile and past performance does not guarantee future results. Always consult a qualified financial advisor before making investment decisions. Prices mentioned are indicative and subject to change. For the most current rates, visit our live dashboard.